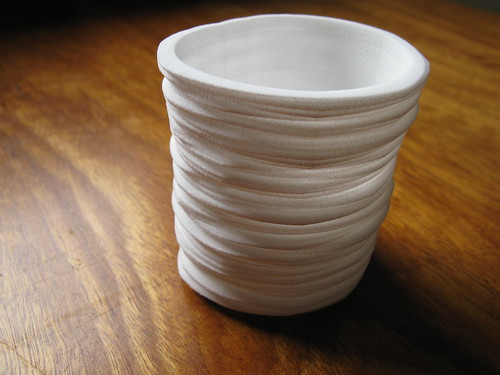
Measuring Cup is a little dataform project I've been working on this year. It's currently showing in Inside Out, an exhibition of rapid-prototyped miniatures at Object gallery, Sydney.
This form presents 150 years of Sydney temperature data in a little cup-shaped object about 6cm high. The data comes from the UK Met Office's HadCRUT subset, released earlier this year; for Sydney it contains monthly average temperatures back to 1859.
The structure of the form is pretty straightforward. Each horizontal layer of the form is a single year of data; these layers are stacked chronologically bottom to top - so 1859 is at the base, 2009 at the lip. The profile of each layer is basically a radial line graph of the monthly data for that year. Months are ordered clockwise around a full circle, and the data controls the radius of the form at each month. The result is a sort of squashed ovoid, with a flat spot where winter is (July, here in the South).
The data is smoothed using a moving average - each data point is the average of the past five years data for that month. I did this mainly for aesthetic reasons, because the raw year-to-year variations made the form angular and jittery. While I was reluctant to do anything to the raw values, moving average smoothing is often applied to this sort of data (though as always the devil is in the detail).
The punchline really only works when you hold it in your hand. The cup has a lip - like any good cup, it expands slightly towards the rim. It fits nicely in the hand. But this lip is, of course, the product of the warming trend of recent decades. So there's a moment of haptic tension there, between ergonomic (human centred) pleasure and the evidence of how our human-centredness is playing out for the planet as a whole.
The form was generated using Processing, exported to STL via superCAD, then cleaned up in Meshlab. The render above was done in Blender - it shows the shallow tick marks on the inside surface that mark out 25-year intervals. Overall the process was pretty similar to that for the Weather Bracelet. One interesting difference in this case is that consistently formatted global data is readily available, so it should be relatively easy to make a configurator that will let you print a Cup from your local data.
Sunday, June 06, 2010
Measuring Cup
Posted by Mitchell at 5:31 pm
Labels: 3d, climatechange, data, dataesthetics, exhibition, fabrication, processing, projects


2 comments:
beautiful piece and a lovely idea
Nice piece, but wouldn't it have been better to use a continuous helix, rather than stacked circles? Time is continuous, not discrete.
Post a Comment