The data from the 2006 Australian census has just been released. In the last day or two the media have run the usual kind of headline stories - in which specific bits of data or comparions are extracted, spun and narrativised; nationally, there's been some focus on increasing debt (and income); locally Canberrans have been portrayed as richer, more wired and more generous with their time than everyone else. This process of top-down public storytelling dominates our understanding of this kind of data - but perhaps that will change, because now the whole dataset is available online, for free. It's buried a few steps in, and yes it's in a proprietary (Excel) format, but it's all there for the munging.
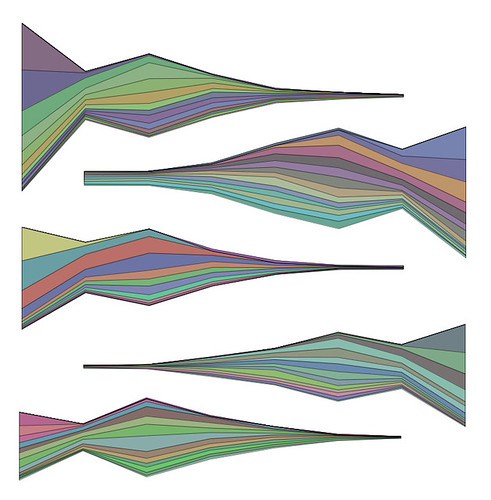
I started browsing some data from my suburb, and focused on numbers of kids per mother per age group. It's coarse-grained data but evocative - birth rates suggest a lot about a society. Comparisons suburb by suburb also hint at distinct demographic patterns. I put together a quick visualisation, a stacked area graph (inspired in part by Lee Byron's beautiful last.fm vis). Another reference was the Japanese tradition of Koinobori, the carp pennants that celebrate Boy's (now Children's) Day. So, here are some statistical pennants - suburban emblems that encode demographic data. Maybe we could fly them at the shops, or individuals could annotate them by marking their own place in the local profile. It's fun to play amateur demographer (read on) but the point here is really proof of concept; if I can do this, so can lots and lots of others, and that's interesting in itself.
Each form shows the number of children per woman; the wide end is zero, the narrow end is six or more. So in all the pennants the initial dip shows the difference between the number of women without children, and women with one child; then more women with two kids, fewer with three and so on. The thicker tail visible in the second pennant shows a larger number of women with lots of kids. The bands in each pennant show age groups, with youngest at the top. Most young women have no kids - not a great surprise - but the forms also show older women with larger families, and the relative distribution of children by mother's age group, and how this varies with suburb. The bottom-most pennant comes from an old, wealthy suburb: lots of older women with two and three kids. Pennant two is from a semi-rural town, with a more even distribution of children through the age bands; pennant three is from a new suburb, with wide bands of small, relatively young families. Colours are arbitrary, for the moment.
For more demographic data art see also Jason Salavon's American Varietal project, commissioned by the US Census Bureau.
Thursday, June 28, 2007
Dataesthetics - Close to Home
Posted by Mitchell at 12:29 pm
Labels: canberra, census, dataesthetics, visualisation


No comments:
Post a Comment